
Time Series Heat Maps in Risk Reports
By Brian Le
A risk report is a product we deliver to customers that highlights observed risks in a facility with the objective is to help reduce potential losses from injuries. It is a method we use to communicate the risks we discover in the video data tied to insights from our data science team and safety recommendations from our loss control team to the customer.
The risk report generation process has numerous steps starting from data collection and ingestion to data analysis and video review. We collect hours of video data, typically within a 2 week period, from strategically selected cameras that provide an general overview of the activity and risks within the facility. From there, we ingest the video data through a pipeline where we perform object tracking and event detection using computer vision models that capture forklifts, workers and safety events detected into bounding boxes and collected into our database. Using this kind of data allows our data science team to build powerful analyses, such as time series heat maps on activity and risks.
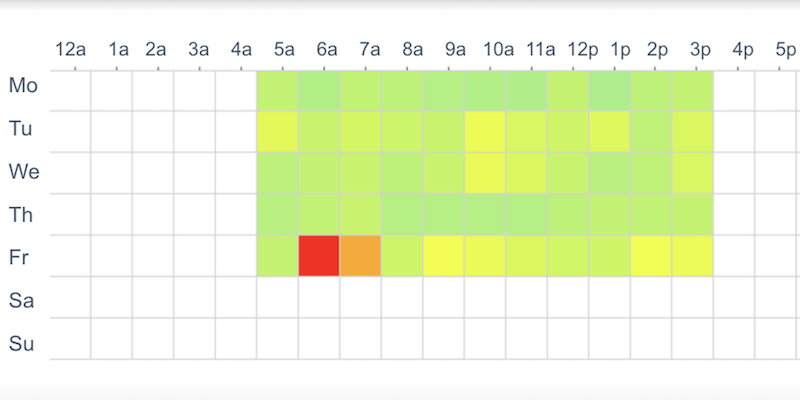
Time Series Heat Map of Ergonomic Activity
In the heat map above, we are observing ergonomic activity within a 2 week report period for a single customer. Each cell represents a single hour period for a given day of the week as event counts normalized by number of workers. From the chart, we can observe that Fridays from 6am to 7am contain the most ergonomic risk. During this time, workers are engaging in very frequent ergonomic activities in comparison to the rest of the periods, which is a leading indicator of ergonomic injuries such as muscle strains. To generate the heat map, we group the data by time of the day and day of the week and then plot the period counts relative to their density levels.
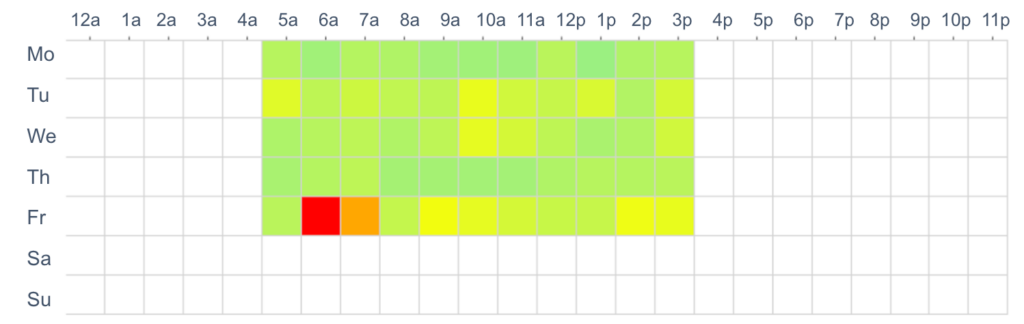
Time Series Heat Map of Worker Activity
The difference between this heat map and the previous one is the metric represented in each cell. Here we are observing total worker hours, which is the total duration of each worker detected in every camera. From the chart, we can observe that work tends to ramp up after the first hour, slow down before lunch, pick back up and then drop at the last hour of the day. Intuitively, this makes sense as teams usually initiate their work day with a meeting and then slow down productivity after hours of working in anticipation of clocking out for lunch or the day. We also find that Fridays are the slowest day in the week, but have the highest ergonomic risk as stated from the previous heat map. Ultimately, these charts help our team and the customer understand peak hours of activity and risk to focus their attention to when looking to reduce risk.
After a risk report is completed, our team delivers the report to the customer in a virtual meeting where we go through the report as a presentation. During this process, we ensure that the customer understands the content of the report and most importantly, the insights and recommendations we provide. In order for the customer to take advantage and reduce risk in potential losses, they should consider the recommendations and how to execute on them. This may include additional training, purchasing equipment, improving processes, etc. After their first risk report is delivered, we allow the customer time to make the changes and collect data at a later period, typically a few months later to ensure that we capture the changes. Our team then runs a second risk report with a different structure that tracks any change in the metrics highlighted in the report to gather and deliver insights on their progress.
Latest Posts
October 17, 2023
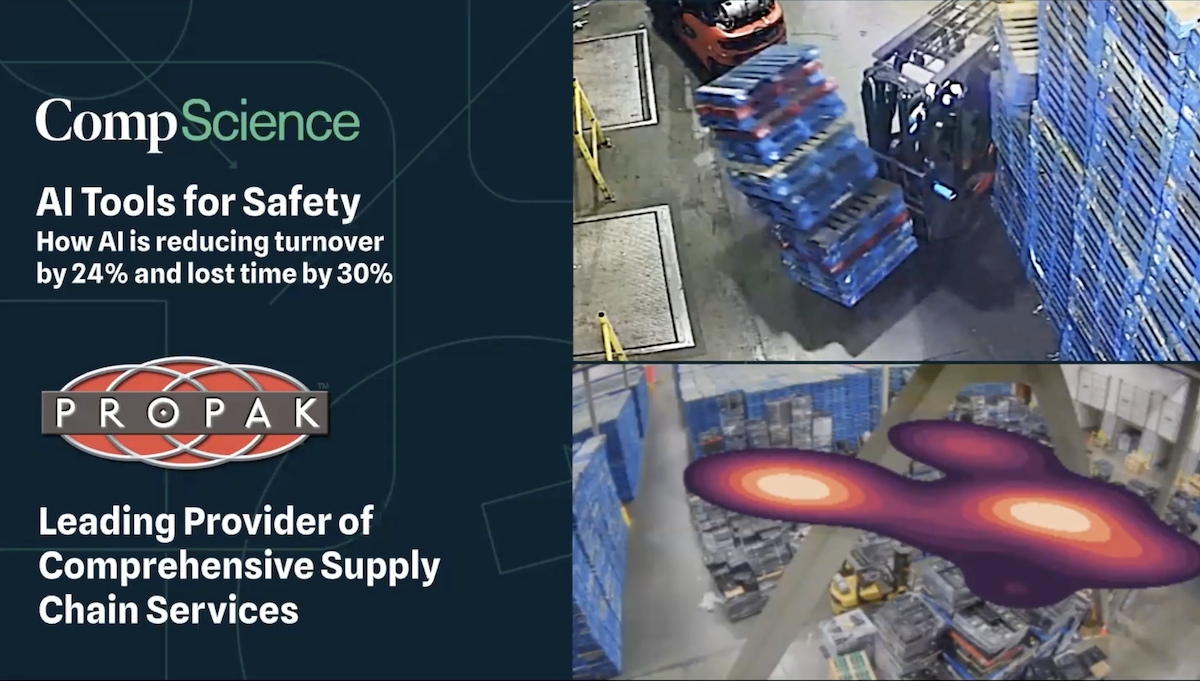
AI Tools for Safety
AI Tools for Safety: A Pre National Safety Council Webinar AI is rapidly transforming workplace risk. Now, CompScience gives safety professionals tools to quickly report risk, train workers and measure improvements which we will demo in the Safety Tech Pavilion at the NSC Congress. Join the webinar plus QA with CompScience CEO Josh Butler […]
Read more
June 20, 2023
Workplace Safety AI: The Webinar for Workers’ Comp Agents
Learn why AI is rapidly transforming workplace safety into a differentiator and how you can use safety analytics from CompScience to help clients lower injury rates and lower costs. Mike Seling and Jacob Geyer explain how AI is rapidly transforming workplace safety into a differentiator for agents and how you can use safety analytics help […]
Read more
April 27, 2023
How To Reduce DART Rates
Reducing the dart rate is a critical goal for any safety manager, as it directly relates to the safety and well-being of employees in the workplace. The dart rate, also known as the days away, restricted, or transferred rate, measures the number of days employees are away from work due to occupational injuries or illnesses. […]
Read more
March 26, 2025
Making Safety a Smart Investment
How CompScience Transforms Workplace Risk Management Workplace safety goes beyond compliance. It is essential for business continuity, operational efficiency, and protecting your most valuable asset: your workforce. Yet, for many companies, safety improvements remain an afterthought, seen as an expense rather than an investment. The reality? Poor ergonomics and workplace injuries result in direct costs, […]
Read more
February 27, 2025
CompScience Raises $27.6M to Advance AI-Powered Workplace Safety
“CompScience, the leading active commercial P&C insurance, today announced the successful close of its $27.6M Series B funding round, led by Sands Capital. This investment will accelerate product innovation, scale operations, and expand market reach to help more organizations prevent serious injuries and fatalities (SIFs). Other investors, including Four More Capital, Working Capital, and Valor […]
Read more
December 11, 2024
Revolutionizing Workplace Safety with CompScience’s Risk Report
At CompScience, we believe that managing workplace safety should be simple, actionable, and impactful. That’s why our workers’ comp program includes a unique service: a personalized AI-powered Risk Report. This tool empowers clients to tackle safety concerns head-on, driving better outcomes, reducing injury rates, and lowering claims frequency. Our Risk Report isn’t just data; […]
Read more
November 21, 2024
How CompScience is Revolutionizing Workers’ Comp: Insights from Josh Butler on the InsurTech Geek Podcast
At CompScience, we’re driven by a mission to make workplaces safer and insurance smarter. Recently, our founder and CEO, Josh Butler, had the incredible opportunity to share our story and vision on the InsurTech Geek Podcast. In this episode, Josh explores the cutting-edge ways CompScience is leveraging AI, computer vision, and data science to […]
Read more
November 21, 2024
Winter Workplace Hazards: Tips for Hazardous Industries
Winter brings unique challenges to workplaces, especially in industries where medium to high hazards are already part of the environment. Icy conditions, heavier gear, and changes in workflow all contribute to increased risks. Addressing slip/trip/fall incidents, ergonomic challenges, and powered machinery hazards is critical to keeping workers safe and preventing costly workers’ comp claims. Here […]
Read more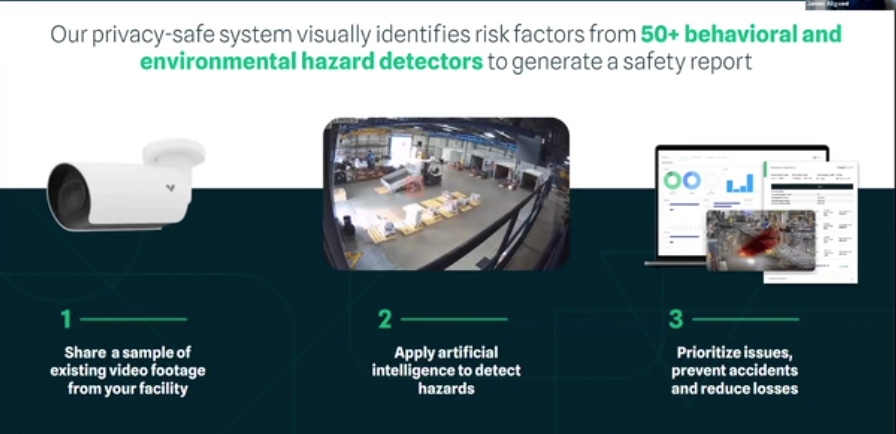
October 30, 2024
Revolutionizing Workplace Safety: CompScience’s AI-Powered Integration with Verkada’s Camera Systems
At CompScience, we’re dedicated to using AI-powered safety analytics to help organizations prevent workplace injuries and enhance risk management. By integrating with Verkada’s state-of-the-art camera systems, we’re providing safety professionals with unparalleled insights and the tools needed to create safer work environments. In our recent webinar, we highlighted how this seamless integration between CompScience […]
Read more